Al Scatter Plot Generator
Transform complex data into clear visual insights with our advanced scatter plot generator.
Simply describe your idea, and watch as AI creates professional plots instantly.
From Data Complexity to Visual Clarity
Traditional scatter plot creation demands technical expertise and time-consuming data preparation. Our scatter plot maker transforms these challenges into opportunities for efficient visualization.
Natural Expression.
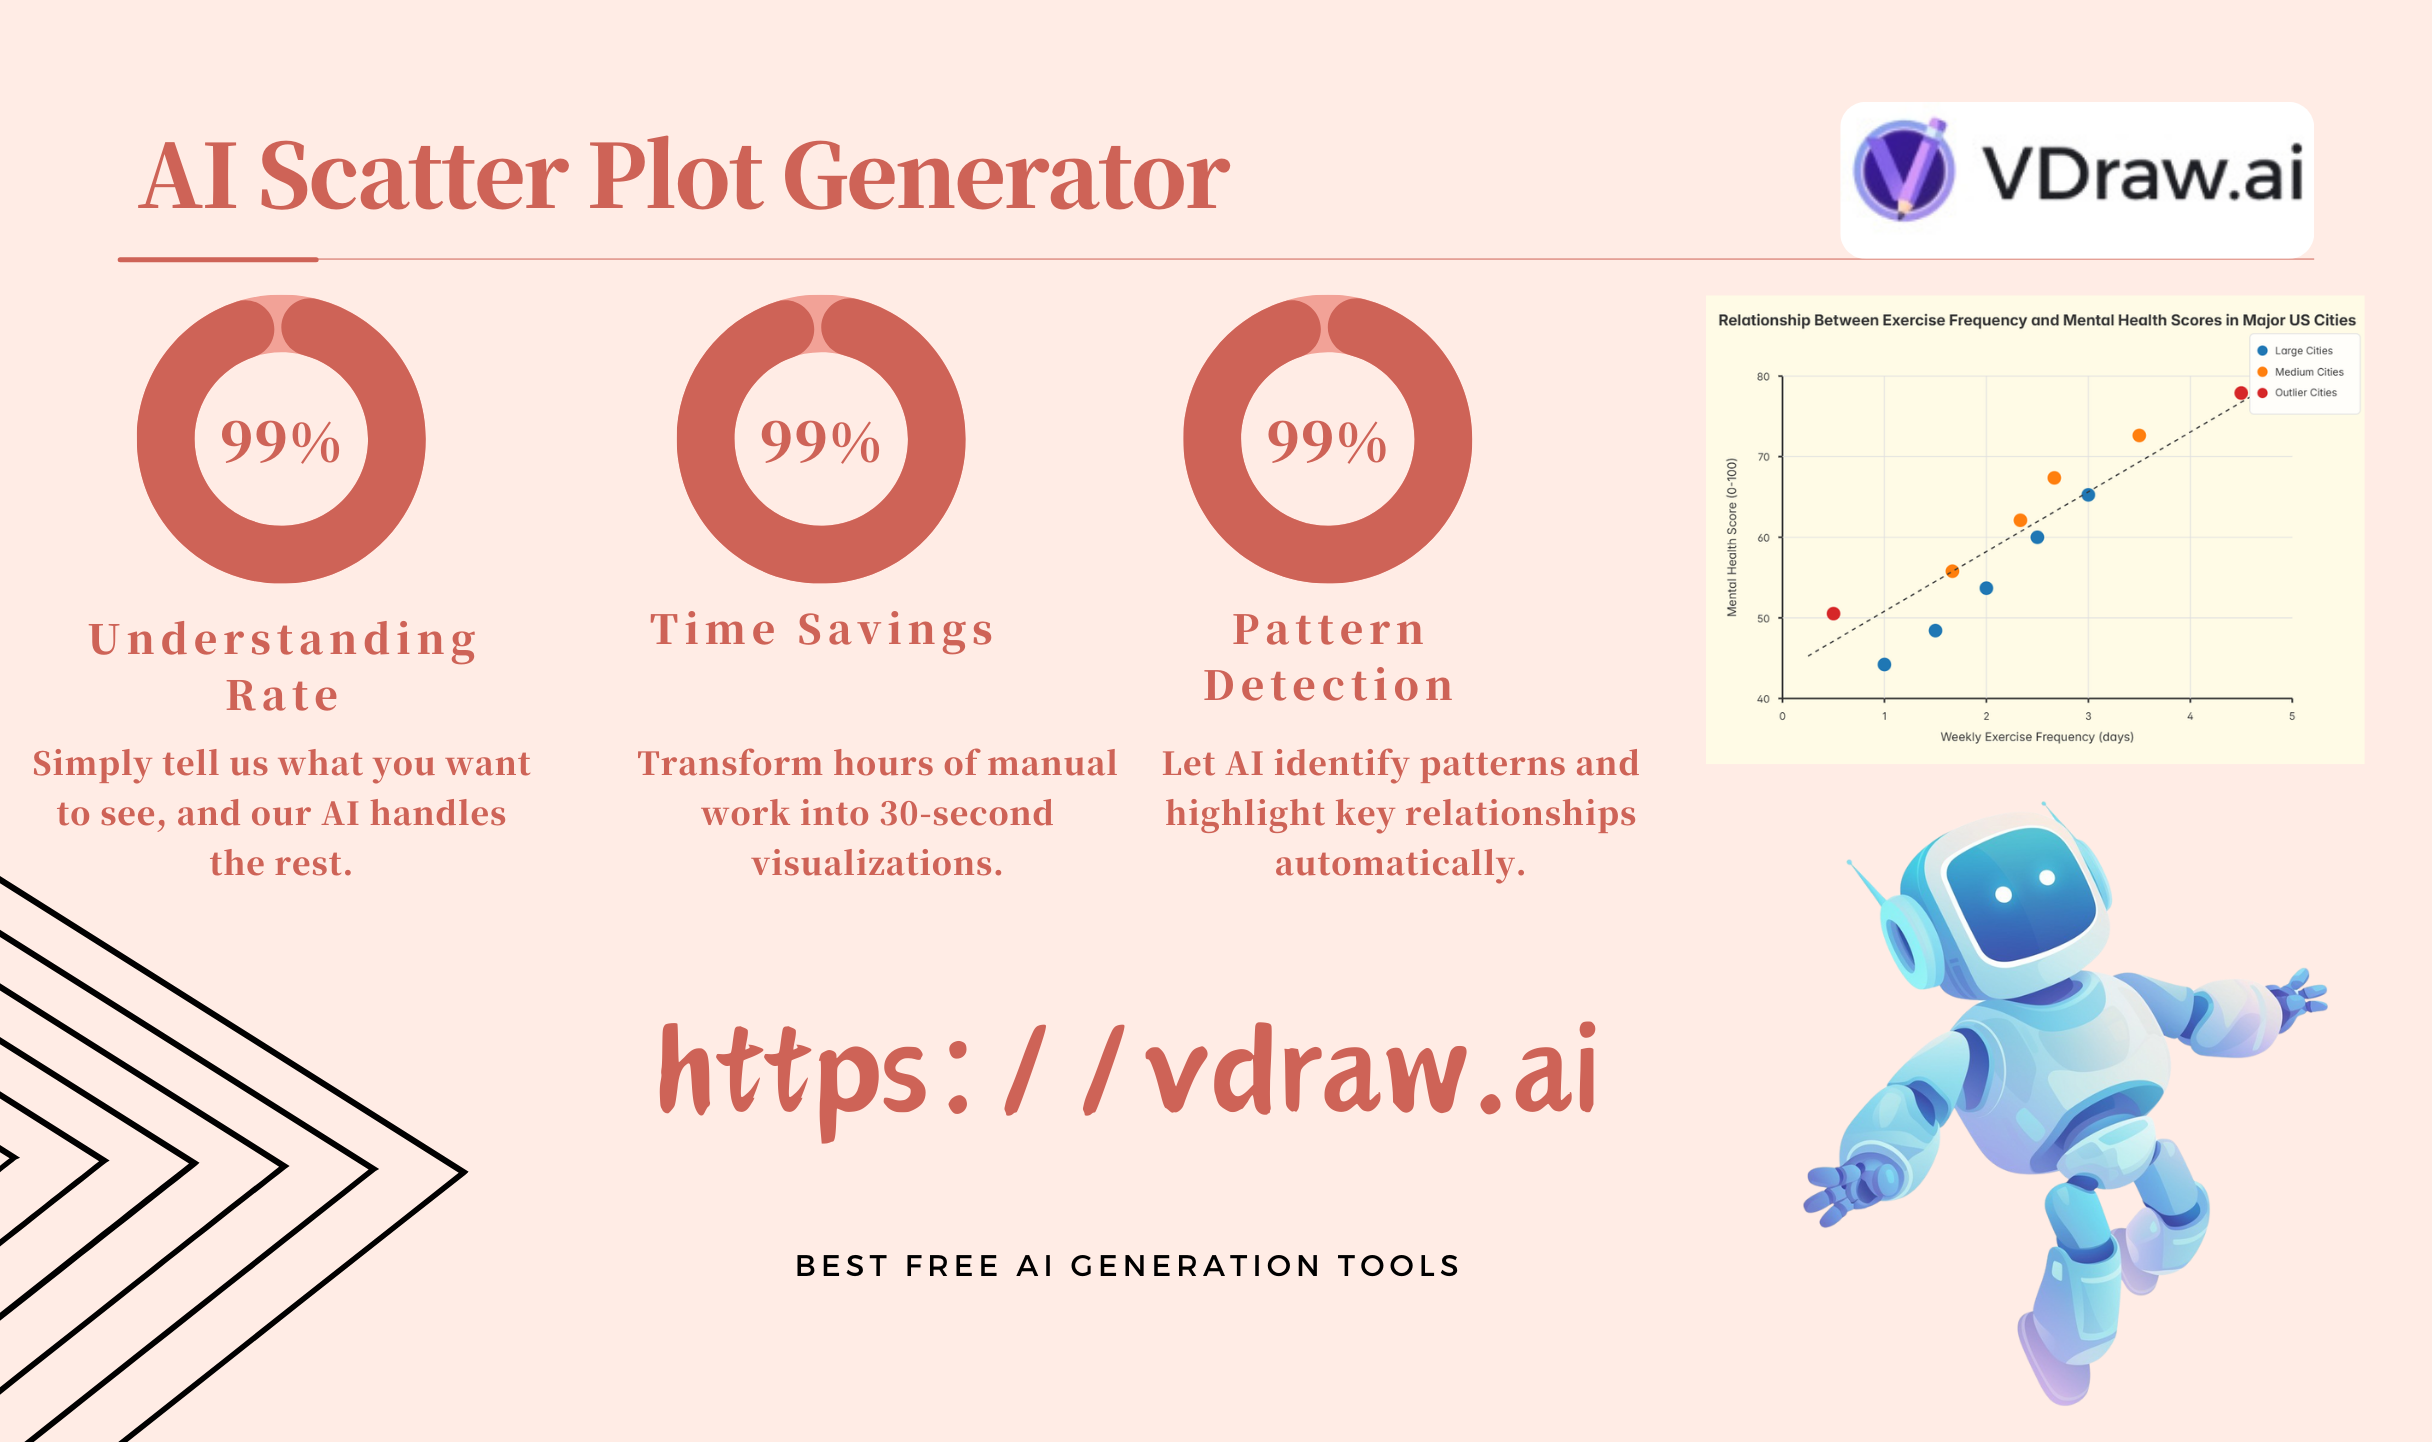
- Simply tell us what you want to see, and our AI handles the rest.
Instant Access.
- Skip the coding lessons - create professional plots through conversation.
Quick Results.
- Transform hours of manual work into 30-second visualizations.
Complete Freedom.
- Any data relationship you can describe, scatter plot generator can visualize.
Smart Refinement.
- Perfect your plots through simple dialogue with AI.
Automated Insights.
- Let AI identify patterns and highlight key relationships automatically.
Statistical Visualization in 3 Steps
Step 1 - Data Description
Describe your data relationship, like "Generate a scatter plot showing age vs. income with 95% confidence intervals"

Step 2 - Advanced Generation
Initialize AI analysis - scatter plot generator will be soon return results.
Step 3 - Statistical Output
Export analysis, PNG format, use for everywhere.
Statistical Analysis Success Stories
Our scatter plot generator transforms complex data analysis workflows across industries. Here's how organizations leverage our statistical visualization capabilities.
User Success Stories
Data Science
: Generate plots with statistical significance markers. Visualize multi-dimensional relationships with color mapping. Create predictive trend analysis visualizations.
Research Analysis
: Plot complex datasets with automated clustering. Generate publication plots with statistical annotations. Visualize confidence intervals and p-values.
Business Intelligence
: Create forecasting visualizations with trend lines. Generate automated quarterly performance comparisons. Plot market segmentation with cluster analysis.


The numbers
Used by Research Institutions
- 2000+
Understanding Rate
- 99%
Data Accuracy
- 99%
Pattern Detection
- 99%
Experience Advanced Statistical Visualization
Join data scientists and researchers who discover hidden patterns daily. Our advanced scatter plot generator combines statistical analysis with stunning visualizations.
What People Are Saying About Scatter Plot Generator?
"This scatter plot generator is revolutionary for statistical analysis. Built-in confidence intervals and automatic outlier detection save hours of work." "

"The statistical insights feature is a game-changer. Our generator doesn't just plot data - it helps interpret patterns and correlations."

"Perfect for complex multi-dimensional datasets. Automated clustering visualization has transformed how we analyze genetic expressions."

"The predictive trend analysis feature helps us spot market patterns instantly. Essential for our quantitative trading strategies."

"Finally, a scatter plot generator that understands statistical significance. Perfect for teaching advanced data analysis."

"Real-time collaboration features revolutionized our team's workflow. We can analyze and iterate on visualizations together."

"The automated statistical annotation feature is brilliant. Saves hours in preparing publication-quality figures."

"Love how it automatically generates correlation matrices and p-values. Perfect for machine learning feature analysis! 📊"

"The multi-dimensional visualization capabilities are incredible. Handles complex financial data like a charm."

"Automated confidence intervals and statistical testing make research visualization so much easier! No more manual calculations 🙌"

"The integration of advanced statistical tools with intuitive visualization is perfect for our clinical trials analysis."

FAQs About Free Scatter Plot Graph Creator
Our generator combines statistical analysis with visualization:
- Zero Data Entry Required Just describe your visualization in natural language - no spreadsheets or data prep needed
- Advanced AI Understanding 95% accurate interpretation of complex statistical requirements and relationships
- Smart Statistical Analysis Built-in trend detection, confidence intervals, and predictive analytics that work instantly
Yes! With the help of AI capabilities, out scatter plot generator can handle data visualization from various dimensions.
Our generator automatically provides:
- Trend line analysis
- Outlier detection
- Confidence intervals
- Statistical significance tests
Just now we don't support teamwork, but in the feature Teams can:
- Share interactive plots
- Add annotations
- Track changes
- Comment on insights
Our advanced analytics include:
- Pearson correlation
- Linear regression
- Cluster analysis
- Outlier detection